Running a restaurant can be challenging, and even more so if you don’t know which items on your menu are actually driving your profits. According to Restaurants Canada, half of all foodservice companies are operating at a loss or just breaking even.
With ongoing uncertainty and inflationary pressures in the restaurant industry, it’s more important than ever for restaurant owners to understand exactly how much each dish contributes to their margins.
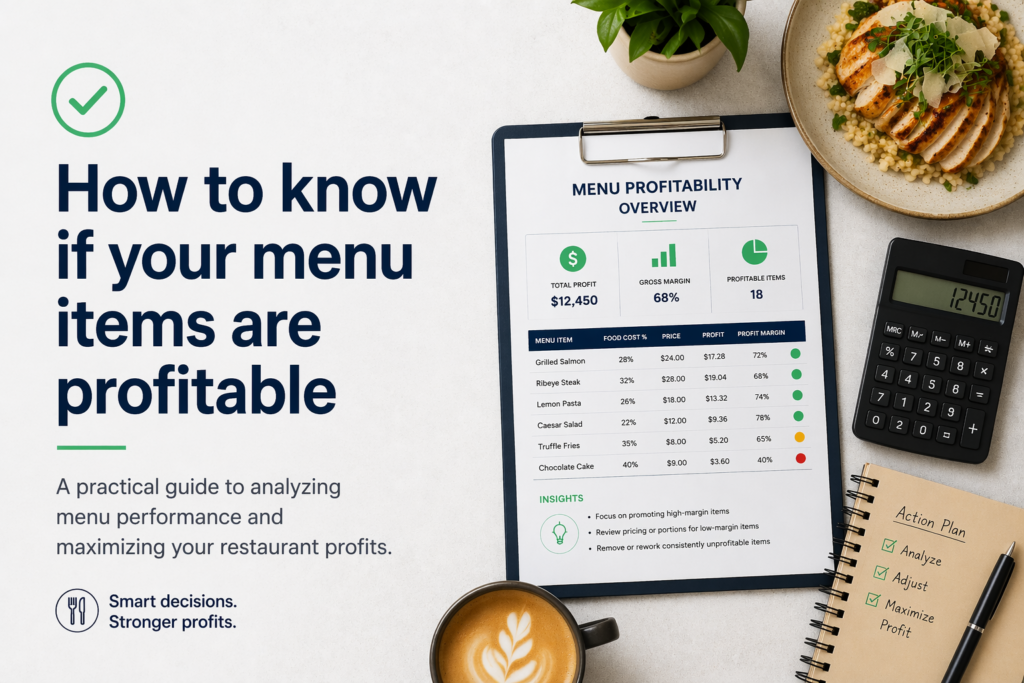
This guide walks through a simple, practical method to calculate menu item profitability.
Step 1: Start with the portions
Many restaurant owners don’t have standardized portion sizes. This creates two major problems:
- Inconsistent profitability
- Inconsistent customer experience
This becomes even more important for multi-location restaurants, where customers expect the same quality and quantity at every location.
The first step is to measure how much of each ingredient goes into a dish. One of the easiest ways to do this is the kitchen scale method, which only requires an inexpensive kitchen scale like this one.
How to Use the Kitchen Scale Method
- Set your scale to grams
- Place your serving plate on the scale
- Press the zero or tare button
- Plate the dish as you normally would
- Record the weight of each ingredient
You can press zero after each ingredient to get separate readings.
Example: No-Bake Peanut Butter Oat Bars (1 serving)
| Ingredient | Weight (grams) |
| Rolled Oats | 200 g |
| Peanut Butter | 150 g |
| Honey | 100 g |
| Chocolate Chips | 60 g |
| Butter | 30 g |
The key is to train staff to aim for these portions consistently. It doesn’t need to be perfect (a 5-10% variation is normal), but having a target is far better than guessing.
Step 2: Calculate the Ingredient Costs
Next, review your supplier invoices. Restaurants typically purchase ingredients in bulk to reduce costs.
Example Supplier Costs
| Product | Weight | Price |
| Rolled Oats | 10.32 kg | $ 67.99 |
| Peanut Butter | 1 kg | $ 7.99 |
| Pure Liquid Honey | 1 kg | $ 8.97 |
| Semi‑Sweet Chocolate Chips | 1 kg | $ 14.97 |
| Unsalted Butter | 454 g | $ 4.67 |
Now convert these into cost per gram:
| Product | Weight (in grams) | Price | Unit Price (Price / Weight |
| Rolled Oats | 10,320 g | $ 67.99 | $ 0.0066 |
| Peanut Butter | 1,000 g | $ 7.99 | $ 0.0080 |
| Pure Liquid Honey | 1,000 g | $ 8.97 | $ 0.0090 |
| Semi‑Sweet Chocolate Chips | 1,000 g | $ 14.97 | $ 0.0150 |
| Unsalted Butter | 454 g | $ 4.67 | $ 0.0103 |
Step 3: Calculate the Cost per Dish
Using our portion sizes and unit costs, we can now calculate cost of goods sold (COGS).
No-Bake Peanut Butter Oat Bars (Cost per serving)
| Ingredient | Weight (grams) | Unit Cost | Total (Unit Cost * Weight) |
| Rolled Oats | 200 g | $ 0.0066 | $ 1.32 |
| Peanut Butter | 150 g | $ 0.0080 | $ 1.20 |
| Honey | 100 g | $ 0.0090 | $ 0.90 |
| Chocolate Chips | 60 g | $ 0.0150 | $ 0.90 |
| Butter | 30 g | $ 0.0103 | $ 0.31 |
Total Cost: $4.63
Step 4: Analyzing Profitability
Now that we know the cost of our dish, we can determine profitability.
If the menu price is $8.00, the calculation is:
$8.00 Selling Price – $4.63 COGS = $3.37 Gross Profit
This gives us:
- COGS: 58%
- Gross Profit: $3.37
- Gross Margin: 42%
If your target COGS was 35%, this item is significantly underperforming.
Options to Improve Profitability
- Increase the price to $13.23: To target a COGS of 35%, we would need to take the dollar cost of producing this menu item ($4.63) and divide it by the % margin (35% or 0.35) to get a recommended price of $13.23
- Reduce the costs to $2.80: We can cut back on the portion size to reduce the cost of producing this item from $4.63 to $2.80. This is the cost that would produce a COGS figure of 35%: $8.00 price * 35% COGS = $2.80
- Remove the item entirely: If this item is unprofitable and unpopular, it may be recommended to remove it from the menu entirely to focus on more profitable products.
Conclusion
Understanding menu profitability is one of the most powerful tools a restaurant owner can use. Small adjustments to portion sizes, pricing, or ingredients can dramatically improve margins without increasing sales volume.
By standardizing portions, calculating ingredient costs, and analyzing profitability, restaurant owners can make informed decisions about which menu items deserve to stay and which ones should go.
In an industry where margins are often razor-thin, knowing your numbers isn’t just helpful; it’s essential. Even reviewing just one or two menu items can uncover opportunities to improve your bottom line.
If you’re not sure where to start, we can help. Our team works with restaurant owners to analyze menu profitability, improve margins, and build clearer financial insights for better decision-making. Contact us today for a quote and see how a few small changes can make a meaningful difference in your restaurant’s profitability.